
Climate Literacy: The Essential Principles of Climate Sciences summarizes the most important principles and concepts of climate science. It presents information that individuals and communities need to understand Earth’s climate, impacts of climate change, and approaches for adapting and mitigating change. This article provides background science content knowledge for understanding Essential Principle 4: Climate varies over space and time through both natural and man-made processes.
The essence of this principle is that while weather is variable on short time scales, Earth’s overall climate varies over longer time intervals and that this variation in climate is both natural and caused by humans. Principle 4 also covers climatic processes that cause natural climate variability and even abrupt climate change, which can be triggered by naturally occurring dynamics.
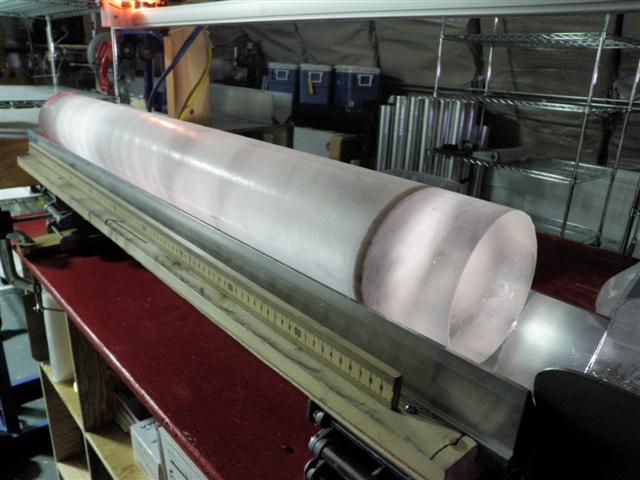
WAIS_ICECORE. Photo courtesy of Heidi Roop, National Science Foundation.
Scientists use proxies, or preserved physical characteristics of the past such as tree rings, fossils, and ice cores to help them understand Earth’s climate in the recent and ancient past. To the right, you can see one such ice core. The dark band in this ice core from the West Antarctic Ice Sheet Divide (WAIS Divide) is a layer of volcanic ash that settled on the ice sheet approximately 21,000 years ago.
In addition, understanding climate variability such as El Niño is critically important in helping scientists determine the sources of a changing climate: natural variation, humans, or a combination of both. In this principle, however, the human impact on the climate through burning of fossil fuels is clearly differentiated from naturally occurring climate relevant processes. Natural processes that influence changes in climate do not account for recent increases of greenhouse gases, temperatures, and sea level rise.
The following concepts are fundamental to understanding Principle 4. You can click on a concept to find the background knowledge to help you understand the concept.
Note: For additional ideas and resources for teaching each of the Essential Principles of Climate Sciences go to the Climate Literacy & Energy Awareness Network. Another good introduction to the seven essential principles is Earth: The Operator’s Manual, an hour-long film shown on PBS and based on the book of the same name by Richard Alley. The entire film is available but the site also provides short segments for teachers to preview and download (free, simple registration required), both with closed captioning for ESL and science comprehension support. A video from the U.S. Environmental Protection Agency (EPA), Climate 101 (second row, middle) explores what climate change is, signs or indicators that the planet is warming, and why it matters. Watch the video to learn more about the causes and effects of climate change and practical solutions to reduce carbon dioxide and other greenhouse gas emissions. An excellent rebuttal of climate change skeptics can be found in Why the Global Warming Skeptics Are Wrong (published 2/22/2012).
Concept A. Climate is determined by the long-term pattern of temperature and precipitation averages and extremes at a location. Climate descriptions can refer to areas that are local, regional, or global in extent. Climate can be described for different time intervals, such as decades, years, seasons, months, or specific dates of the year.
Concept B. Climate is not the same thing as weather. Weather is the minute-by-minute variable condition of the atmosphere on a local scale. Climate is a conceptual description of an area’s average weather conditions and the extent to which those conditions vary over long time intervals.
Concept C. Climate change is a significant and persistent change in an area’s average climate conditions or their extremes. Seasonal variations and multi-year cycles (for example, the El Niño/Southern Oscillation) that produce warm, cool, wet, or dry periods across different regions are a natural part of climate variability. They do not represent climate change.
Concept D. Scientific observations indicate that global climate has changed in the past, is changing now, and will change in the future. The magnitude and direction of this change is not the same at all locations on Earth.
Concept E. Based on evidence from tree rings, other natural records, and scientific observations made around the world, Earth’s average temperature is now warmer than it has been for at least the past 1,300 years. Average temperatures have increased markedly in the past 50 years, especially in the North Polar Region.
Concept F. Natural processes driving Earth’s long-term climate variability do not explain the rapid climate change observed in recent decades. The only explanation that is consistent with all available evidence is that human impacts are playing an increasing role in climate change. Future changes in climate may be rapid compared to historical changes.
Concept G. Natural processes that remove carbon dioxide from the atmosphere operate slowly when compared to the processes that are now adding it to the atmosphere. Thus, carbon dioxide introduced into the atmosphere today may remain there for a century or more. Other greenhouse gases, including some created by humans, may remain in the atmosphere for thousands of years.
You can also see where these concepts are found in national standards documents as well as common misconceptions in the Standards and Curriculum Connections article.
Concept A. Climate is determined by the long-term pattern of temperature and precipitation averages and extremes at a location. Climate descriptions can refer to areas that are local, regional, or global in extent. Climate can be described for different time intervals, such as decades, years, seasons, months, or specific dates of the year.
Climate is the general weather conditions. For example, in the winter, we expect it to often be rainy in Seattle, Washington, sunny and mild in southern California, and very cold and snowy in Buffalo, New York. But it would not be particularly startling to hear of an occasional January day with mild temperatures in Buffalo, rain in Los Angeles, or snow in Seattle. Meteorologists often point out that “climate is what you expect and weather is what you get.” The classical length of record to determine the climate for any particular place is 30 years, as defined by the World Meteorological Organization (WMO). The quantities most often observed are temperature, precipitation, and wind as well as cloud cover and depth of frost penetration. Below is a map showing the climate zones found in the United States based on the work of German climatologist and amateur botanist Wladimir Köppen (1846-1940). He divided the world’s climates into several major categories based upon general temperature profile related to latitude. You will find five of the six categories in the United States – A. Tropical, B. Dry, C. Moist Subtropical Mid-Latitude, D. Moist Continental Mid-latitude, and H. Highlands. The category not covered is E. Polar. You can read a full description of each category here.
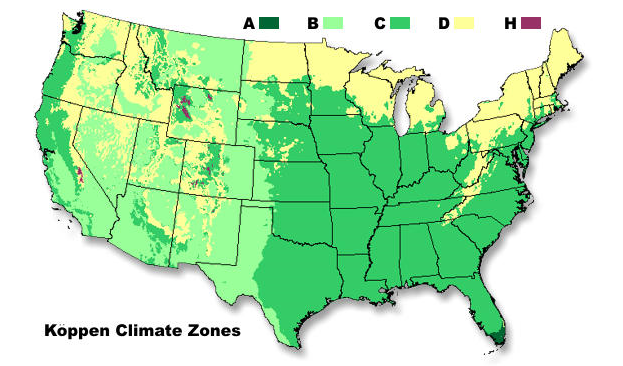
Koppen Climate Zones. Image courtesy of National Weather Service, NOAA.
Concept B. Climate is not the same thing as weather. Weather is the minute-by-minute variable condition of the atmosphere on a local scale. Climate is a conceptual description of an area’s average weather conditions and the extent to which those conditions vary over long time intervals.
Many times the terms “climate” and “weather” are used interchangeably – but they are not the same thing. Weather is the current atmospheric conditions, including temperature, rainfall, wind, and humidity at any given place. If you stand outside, you can tell how hot it is by taking a temperature reading or feel if it is raining or windy, sunny or cloudy. All of these factors make up what we think of as weather. Weather is what is happening right now or likely to happen tomorrow or in the very near future. Weather is the day-to-day state of the atmosphere and its short-term (minutes to weeks) variation. We all check to see what the weather will be where we live or where we will be traveling – we can easily get the current conditions and the forecast for the next few days. The following image is a national forecast map from the National Oceanic and Atmospheric Administration’s (NOAA) National Weather Service.
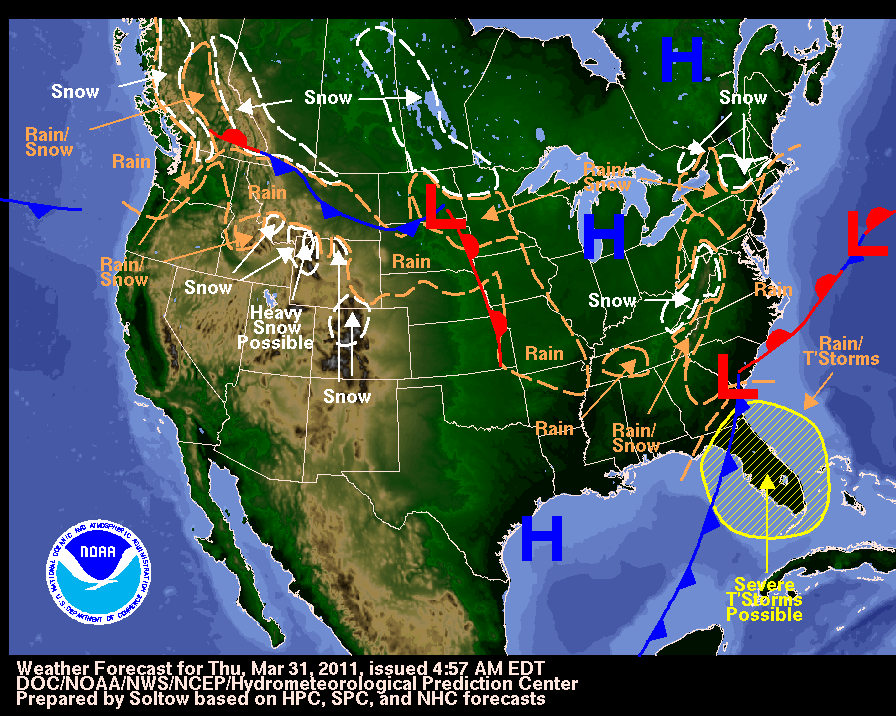
Weather Forecast, March 31, 2011. Courtesy of National Weather Service, NOAA.
Related Resources
What’s the Difference Between Weather and Climate?
This site discusses the differences between the two concepts.
National Forecast Maps
This site provides maps and data or real-time and archived forecasts (local and national), precipitation amounts, cloud cover, wind speed, and much more.
Concept C. Climate change is a significant and persistent change in an area’s average climate conditions or their extremes. Seasonal variations and multi-year cycles (for example, El Niño/Southern Oscillation) that produces warm, cool, wet, or dry periods across different regions are a natural part of climate variability. They do not represent climate change.
On land, especially at high latitudes and elevations, seasonal changes that occur during the normal course of a year are somewhat predictable. Precipitation and temperature patterns occur at more or less the same time each year, with organisms and the land itself responding to the seasonal fluctuations.
However, the ocean retains and releases heat differently than land. While the annual cycle still is important throughout the ocean, its surface waters are separated from colder, deeper water by a thermocline. The upwelling of cold waters, especially along the equator in the eastern half of the Pacific basin, can be blocked when sea level is high, resulting in warm events.
El Niño is a cyclical warming of the ocean waters in the central and eastern tropical Pacific that generally occurs every 3 to 7 years. It is linked with changes in air pressure and high-level winds that can affect weather worldwide. It alternates with La Niña, the cooling of ocean waters in the same region of the Pacific.
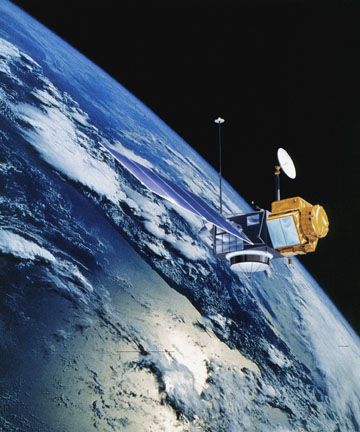
TOPEX/Poseidon over Earth. Image courtesy of NASA Jet Propulsion Laboratory.
Sea-surface heights data from TOPEX/Poseidon and Jason satellites can be used to calculate how much heat is stored in the ocean. The year-to-year and, even, decade-to-decade changes in the ocean that indicate climate events such as the El Niño and La Niña are dramatically visualized by these data. Sea-surface height is the most modern and powerful tool for taking the “pulse” of the global oceans.
Related Resources
El Niño Theme Page
This site provides background information on El Niño and La Niña as well as up-to-the-minute data on these events.
Ocean Surface Topography From Space
This site provides up-to-the-minute satellite data on El Niño and La Niña.
Concept D. Scientific observations indicate that global climate has changed in the past, is changing now, and will change in the future. The magnitude and direction of this change is not the same at all locations on Earth.
Just as climates across the Earth vary widely, the changes that accompany recent climate change are also varied. While globally there is a warming trend, some regions are getting wetter and cooler, while others are getting warmer and drier. It was once thought that climate was generally steady, even-keeled, but we now know that climate change can occur abruptly, as it has many times in the Earth’s past.
The following figure illustrates the basic components that influence the state of the Earth’s climatic system. Changes in the state of this system can occur externally (from extraterrestrial systems) or internally (from ocean, atmosphere and land systems) through any one of the described components. For example, an external change may involve a variation in the sun’s output which would externally vary the amount of solar radiation received by the Earth’s atmosphere and surface. Internal variations in the Earth’s climatic system may be caused by changes in the concentrations of atmospheric gases, mountain building, volcanic emissions, and changes in surface or atmospheric reflectivity (albedo).
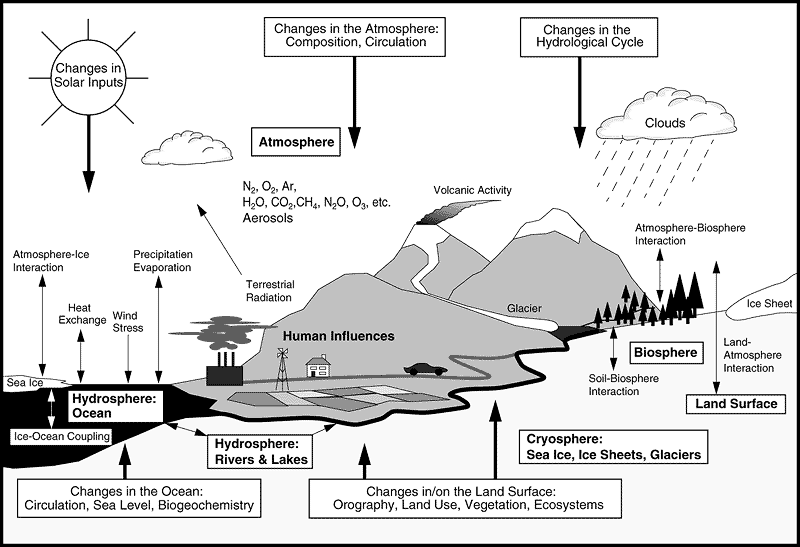
Schematic view of the components of the global climate system (bold), their processes and interactions (thin arrows) and some aspects that may change (bold arrows). Diagram courtesy of IPCC Third Assessment Report, GRID-Arendal.
The work of climatologists has found evidence to suggest that only a limited number of factors are primarily responsible for most of the past episodes of climate change on the Earth. These factors include:
- Variations in the Earth’s orbital characteristics.
- Atmospheric carbon dioxide variations.
- Volcanic eruptions
- Variations in solar output.
Related Resources
Climate History: Exploring Climate Events and Human Development
Using the “powers of ten” to frame particular time scales, Climate History looks at the past 100,000 years of human existence and explores specific climate events which may have challenged or changed human activities.
Concept E. Based on evidence from tree rings, other natural records, and scientific observations made around the world, Earth’s average temperature is now warmer than it has been for at least the past 1,300 years. Average temperatures have increased markedly in the past 50 years, especially in the North Polar Region.
The temperature of the Earth has risen by about of 0.74 °C over the last century. While that may seem like a small increase, it has had profound effects on the planet’s physical and biological systems, which, in turn, have impacted society. A large majority of the climate science community agree that the net effect of human activities since 1750 has been one of warming. They also conclude that most of the observed increase in global average temperatures since the mid-20th century is very likely due to the observed increase in anthropogenic (human-caused) greenhouse gas concentrations.
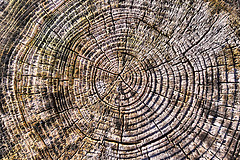
Wood Grain. Photo courtesy of Gordon M. Robertson, flickr.com.
Trees contain some of nature’s most accurate evidence of the past. Their growth layers, appearing as rings in the cross section of the tree trunk, record evidence of floods, droughts, insect attacks, lightning strikes, and even earthquakes. Each year, a tree adds to its girth, the new growth being called a tree ring. Tree growth depends upon local conditions such as water availability.
Because the amount of water available to the tree varies from year to year, scientists can use tree-ring patterns to reconstruct regional patterns of drought and climatic change. This field of study, known as dendrochronology, was begun in the early 1900s by an American astronomer named Andrew Ellicott Douglass.
A tree ring consists of two layers:
- A light colored layer grows in the spring
- A dark colored layer in late summer
During wet, cool years, most trees grow more than during hot, dry years and the rings are wider. Drought or a severe winter can cause narrower rings. If the rings are a consistent width throughout the tree, the climate was the same year after year. By counting the rings of a tree, we can pretty accurately determine the age and health of the tree and the growing season of each year.
Modern dendrochronologists seldom cut down a tree to analyze its rings. Instead, core samples are extracted using a borer that’s screwed into the tree and pulled out, bringing with it a straw-size sample of wood about 4 millimeters in diameter. The hole in the tree is then sealed to prevent disease. Computer analysis and other methods have allowed scientists to better understand certain large-scale climatic changes that have occurred in past centuries.
Concept F. Natural processes driving Earth’s long-term climate variability do not explain the rapid climate change observed in recent decades. The only explanation that is consistent with all available evidence is that human impacts are playing an increasing role in climate change. Future changes in climate may be rapid compared to historical changes.
Of all the factors that cause the climate to change, the increasing concentration of various greenhouse gases in the atmosphere is the most dominant. Several of the major greenhouse gases occur naturally but increases in their atmospheric concentrations over the last 250 years are due largely to human activities. Other greenhouse gases are entirely the result of human activities. Current concentrations of atmospheric carbon dioxide and methane far exceed pre-industrial values found in polar ice core records of atmospheric composition dating back 650,000 years. Multiple lines of evidence confirm that the post-industrial rise in these gases does not stem from natural mechanisms.
There is widespread evidence from all continents and most oceans that many natural systems are being affected by regional climate changes, particularly temperature increases. These changes include:
- Changes in snow, ice and frozen ground have increased the number and size of glacial lakes, increased ground instability in mountain and other permafrost regions and led to changes in some Arctic and Antarctic ecosystems.
- In terrestrial ecosystems, earlier timing of spring events and poleward and upward shifts in plant and animal ranges are linked to recent climate changes.
- In some marine and freshwater systems, shifts in ranges and changes in algal, plankton and fish abundance are associated with rising water temperatures, as well as related changes in ice cover, salinity, oxygen levels and circulation.
Concept G. Natural processes that remove carbon dioxide from the atmosphere operate slowly when compared to the processes that are now adding it to the atmosphere. Thus, carbon dioxide introduced into the atmosphere today may remain there for a century or more. Other greenhouse gases, including some created by humans, may remain in the atmosphere for thousands of years.
Of the greenhouse gases, carbon dioxide is perhaps the most important because of its links to human activities. Since the Industrial Revolution, atmospheric carbon dioxide has risen by 30 percent, while average global temperatures have climbed about 0.5°C. On average, carbon dioxide resides in the atmosphere about 100 years before it settles into the ocean, or is taken out of the atmosphere by plants. The oceanic removal of carbon dioxide from the atmosphere has a cooling affect on global temperatures. Unfortunately, the increased carbon dioxide in the ocean changes the water, making it more acidic.
The following images shows that carbon dioxide levels in our atmosphere are rising. Both images show the spreading of carbon dioxide around the globe as it follows large-scale patterns of circulation in the atmosphere. The color codes in these two pictures are different in order to account for the carbon dioxide increase from 2003 to 2007. If the color bar for 2003 were to be used for 2007, the resulting 2007 map would be saturated with reddish colors, and the fine structure of the distribution of carbon dioxide obscured.
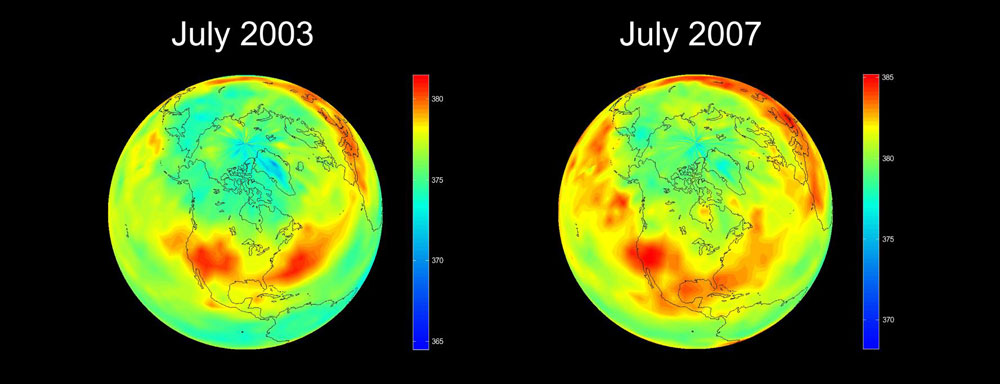
Images from the Atmospheric Infrared Sounder (AIRS) instrument onboard NASA's Aqua spacecraft. Image courtesy of NASA/JPL.
Kimberly Lightle wrote this article. She received her PhD in science education at The Ohio State University and is principal investigator of Beyond Weather and the Water Cycle, Beyond Penguins and Polar Bears, and the Middle School Portal 2 projects. Email Kim at beyondweather@msteacher.org
Copyright July 2011 – The Ohio State University. This material is based upon work supported by the National Science Foundation under Grant No. 1034922. Any opinions, findings, and conclusions or recommendations expressed in this material are those of the author(s) and do not necessarily reflect the views of the National Science Foundation. This work is licensed under an Attribution-ShareAlike 3.0 Unported Creative Commons license.