Climate Literacy: The Essential Principles of Climate Sciences summarizes the most important principles and concepts of the climate sciences. It presents information that individuals and communities need to understand Earth’s climate, the impacts of climate change, and approaches for adapting and mitigating change. This article provides background science content knowledge for understanding Essential Principle 1.
The Sun is the primary source of energy for Earth’s climate system is the first of seven Essential Principles of Climate Sciences. Principle 1 sets the stage for understanding Earth’s climate system and energy balance. The Sun warms the planet, drives the hydrologic cycle, and makes life on Earth possible. The amount of sunlight received on Earth’s surface is affected by the reflectivity of the surface, the angle of the Sun, the output of the Sun, and the cyclic variations of the Earth’s orbit around the Sun.
The following concepts are fundamental to understanding Principle 1. Click on a concept to find the background knowledge needed to understand the concept.
Concept A. Sunlight reaching the Earth can heat the land, ocean, and atmosphere. Some of that sunlight is reflected back to space by the surface, clouds, or ice. Much of the sunlight that reaches Earth is absorbed and warms the planet.
Concept B. When Earth emits the same amount of energy as it absorbs, its energy budget is in balance, and its average temperature remains stable.
Concept C. The tilt of Earth’s axis relative to its orbit around the Sun results in predictable changes in the duration of daylight and the amount of sunlight received at any latitude throughout a year. These changes cause the annual cycle of seasons and associated temperature changes.
Concept D. Gradual changes in Earth’s rotation and orbit around the Sun change the intensity of sunlight received in our planet’s polar and equatorial regions. For at least the last 1 million years, these changes occurred in 100,000-year cycles that produced ice ages and the shorter warm periods between them.
Concept E. A significant increase or decrease in the Sun’s energy output would cause Earth to warm or cool. Satellite measurements taken over the past 30 years show that the Sun’s energy output has changed only slightly and in both directions. These changes in the Sun’s energy are thought to be too small to be the cause of the recent warming observed on Earth.
You can also see where these concepts are found in national standards documents as well as common misconceptions in the Standards and Curriculum Connections article.
Note: For additional ideas and resources for teaching each of the Essential Principles of Climate Sciences go to the Climate Literacy & Energy Awareness Network. Another good introduction to the seven essential principles is Earth: The Operator’s Manual, an hour-long film shown on PBS and based on the book of the same name by Richard Alley. The entire film is available but the site also provides short segments for teachers to preview and download (free, simple registration required), both with closed captioning for ESL and science comprehension support. A video from the U.S. Environmental Protection Agency (EPA), Climate 101 (second row, middle) explores what climate change is, signs or indicators that the planet is warming, and why it matters. Watch the video to learn more about the causes and effects of climate change and practical solutions to reduce carbon dioxide and other greenhouse gas emissions. An excellent rebuttal of climate change skeptics can be found in Why the Global Warming Skeptics Are Wrong (published 2/22/2012).
ConceptA. Sunlight reaching the Earth can heat the land, ocean, and atmosphere. Some of that sunlight is reflected back to space by the surface, clouds, or ice. Much of the sunlight that reaches Earth is absorbed and warms the planet.
Did you know that the Sun blasts more than a billion tons of matter out into space at millions of kilometers per hour?
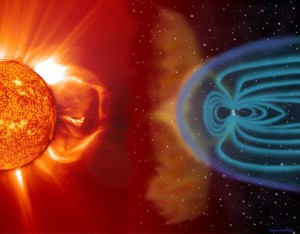
Courtesy of SOHO consortium. SOHO (Solar and Heliospheric Observatory) is a project of international cooperation between the European Space Agency and NASA
Ultimately, energy from the Sun is the driving force behind weather and climate, and life on earth. But what kinds of energy come from the Sun? How does that energy travel through space? And what happens when it reaches Earth?
The Sun emits many forms of electromagnetic radiation in varying quantities. As shown in the following diagram, about 43 percent of the total radiant energy emitted from the Sun is in the visible parts of the spectrum. The bulk of the remainder lies in the near-infrared (49 percent) and ultraviolet section (7 percent). Less than 1 percent of solar radiation is emitted as x-rays, gamma waves, and radio waves.
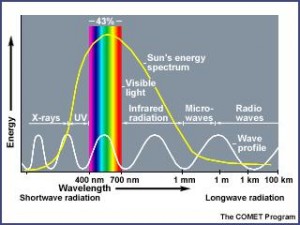
Copyright 2000-2001 University Corporation for Atmospheric Research. All Rights Reserved. Used with permission.
The transfer of energy from the Sun across nearly empty space (remember that space is a vacuum) is accomplished primarily by radiation. Radiation is the transfer of energy by electromagnetic wave motion.
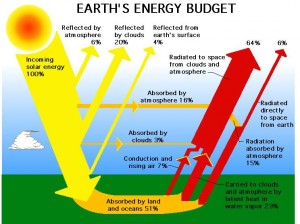
Once the Sun’s energy reaches Earth, it is intercepted first by the atmosphere. A small part of the Sun’s energy is directly absorbed, particularly by certain gases such as ozone and water vapor.
Some of the Sun’s energy is reflected back to space by clouds and Earth’s surface.
Most of the radiation, however, is absorbed by Earth’s surface. When the radiation is absorbed by a substance, the atoms in the substance move faster and the substance becomes warm to the touch. The absorbed energy is transformed into heat energy. This heat energy plays an important role in regulating the temperature of Earth’s crust, surface waters, and lower atmosphere.
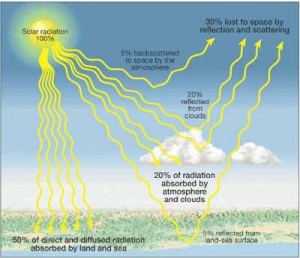
Copyright 2000-2001 University Corporation for Atmospheric Research. All Rights Reserved. Used with permission.
Every surface on Earth absorbs and reflects energy at varying degrees, based on the surface’s color and texture. Dark-colored objects absorb more visible radiation; light-colored objects reflect more visible radiation. Shiny or smooth objects reflect more, while dull or rough objects absorb more. Differences in reflection impact temperature, weather, and climate.
Scientists use the term albedo to describe the percentage of solar radiation reflected back into space by an object or surface.
A perfectly black surface has an albedo of 0 (all radiation is absorbed). A perfectly white surface has an albedo of 1.0 (all radiation is reflected).
Different features of Earth (such as snow, ice, tundra, ocean, and clouds) have different albedos. For example, land and ocean have low albedos (typically from 0.1 to 0.4) and absorb more energy than they reflect. Snow, ice, and clouds have high albedos (typically from 0.7 to 0.9) and reflect more energy than they absorb.
Earth’s average albedo is about 0.3. In other words, about 30 percent of incoming solar radiation is reflected back into space and 70 percent is absorbed.
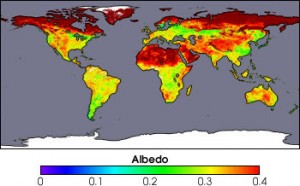
A sensor aboard NASA’s Terra satellite is now collecting detailed measurements of how much sunlight Earth’s surface reflects back up into the atmosphere. By quantifying precisely our planet’s albedo, the Moderate Resolution Imaging Spectroradiometer (MODIS) is helping scientists understand and predict how various surface features influence both short-term weather patterns as well as longer-term climate trends.
The colors in this image emphasize the albedo over the Earth’s land surfaces, ranging from 0.0 to 0.4. Areas colored red show the brightest, most reflective regions; yellows and greens are intermediate values; and blues and violets show relatively dark surfaces. White indicates where no data were available, and no albedo data are provided over the oceans.
As shown in the image, the snow- and ice-covered Arctic has a high albedo. (Though no data were available, Antarctica would also have a high albedo.) Desert areas, such as the Sahara in Northern Africa, also reflect a great deal of radiation. Forested areas or areas with dark soil absorb more radiation and have lower albedos.
Human and natural processes have changed the albedo of Earth’s land surfaces. Human impacts such as deforestation, air pollution, and the decrease in Arctic sea ice have affected albedo values. These changes alter the net amounts of energy absorbed and radiated back to space.
Resources
SDO First Light
The Solar Dynamics Observatory (SDO) is now NASA’s best eye on the sun, with a resolution far-exceeding any previous telescope. These are some of the first images from the satellite – they are absolutely amazing.
Striking a Solar Balance
This short film (3.6 minutes) from NASA explores the vital connection between the Earth and the Sun.
Earth’s Albedo and Global Warming
This interactive activity adapted from NASA and the U.S. Geological Survey illustrates the concept of albedo.
Climate Change: How Do We Know?
This page from the NASA’s Eyes on the Earth Global Climate Change web site provides an overview of the most compelling research that supports human-induced and rapid climate change.
Concept B. When Earth emits the same amount of energy as it absorbs, its energy budget is in balance, and its average temperature remains stable.
Earth’s radiation budget is a concept that helps us understand how much energy Earth receives from the Sun, and how much energy Earth radiates back to outer space. Earth’s temperature doesn’t infinitely rise because heat is always radiating back to space. Solar heat is redistributed from the equator toward the poles as well as from the Earth’s surface and lower atmosphere back to space. Clouds also transport energy away from the surface of the Earth.
Solar heating drives evaporation. Warm, moist air becomes buoyant and rises, moving energy from the surface high into the atmosphere. Energy is released back into the atmosphere when the water vapor condenses into liquid water or freezes into ice crystals. This net flow of energy into and out of the Earth system is Earth’s energy budget.
When the flow of incoming solar energy is balanced by an equal flow of heat to space, Earth is in radiative equilibrium, and global temperature is relatively stable. Anything that increases or decreases the amount of incoming or outgoing energy disturbs Earth’s radiative equilibrium; global temperatures rise or fall in response. Changes in Earth’s crust, such as glaciation, deforestation, and polar ice melting, alter the quantity and wavelength of electromagnetic absorption and reflection at the Earth’s surface. These destabilizing influences are called climate forcings.
Man-made forcings include particle pollution (aerosols), which absorb and reflect incoming sunlight; deforestation, which changes how the surface of the Earth reflects and absorbs sunlight; and the rising concentration of atmospheric carbon dioxide and other greenhouse gases, which decrease heat radiated to space. A forcing can trigger feedback loops that can intensify or weaken the original event.

Shiveluch Volcano, Kamchatka Peninsula, Russia. Photo courtesy of International Space Station Imagery, NASA Human Space Flight.
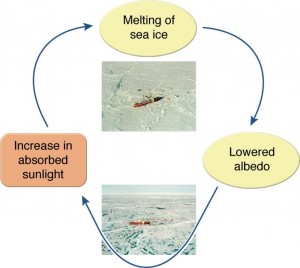
The loss of ice at the poles, which makes them less reflective, is an example of a feedback loop. The decreasing extent of ice in the polar regions (in particular, the sea ice of the Arctic) is part of a positive feedback loop that can accelerate climate change. Warmer temperatures melt snow and ice, which decreases Earth’s albedo, causing further warming and more melting.
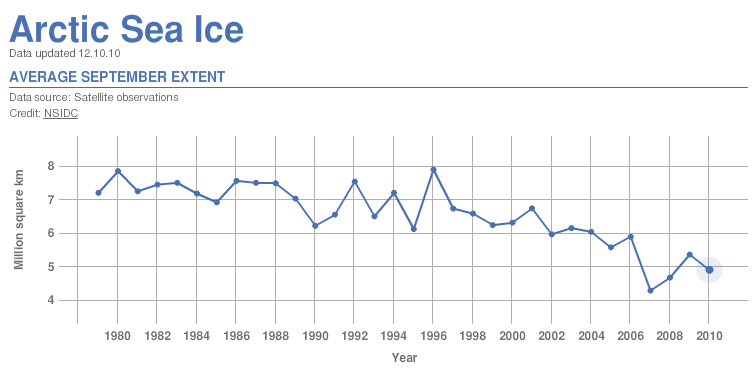
According to NASA, September Arctic sea ice is now declining at a rate of 11.5 percent per decade, relative to the 1979 to 2000 average. Arctic sea ice reaches its minimum each September. The graph below shows the average monthly Arctic sea ice extent in September from 1979 to 2010, derived from satellite observations. The September 2010 extent was the third lowest in the satellite record. You can see interactive graphs for five key indicators on the NASA’s Eyes on the Earth Global Climate Change Key Indicators web site page.
Resources
Climate Change: Striking a Solar Balance (3:35)
This NASA video reviews the role of the sun in driving the climate system. It uses colorful animations to illustrate Earth’s energy balance and how increased greenhouse gases are creating an imbalance in the energy budget, leading to warming. The video also reviews how the NASA satellite program collects data on the sun.
Earth’s Energy Budget
This feature article from NASA’s Earth Observatory provides additional information on the concept of Earth’s energy balance.
Clouds: The Wild Card of Climate Change
This resource tries to answer the question “Will clouds speed or slow global warming?”
Concept C. The tilt of Earth’s axis relative to its orbit around the Sun results in predictable changes in the duration of daylight and the amount of sunlight received at any latitude throughout a year. These changes cause the annual cycle of seasons and associated temperature changes.
The tilt of Earth’s rotational axis and the Earth’s orbit work together to create the seasons. As the Earth travels around the Sun, it remains tipped in the same direction at an angle of 23.5 degrees, toward the star Polaris. This means that sometimes the northern half of the Earth is pointing toward the Sun (summer), and sometimes it is pointing away (winter).
The points in the Earth’s orbit when it is tilted most toward or away from the Sun are called solstices, and mark the seasons of summer and winter. When the Northern Hemisphere is tilted toward the Sun, the Southern Hemisphere is tilted away. This explains why the hemispheres have opposite seasons. Halfway in between the solstices, the Earth is neither tilted directly toward nor directly away from the Sun. At these times, called the equinoxes, both hemispheres receive roughly equal amounts of sunlight. Equinoxes mark the seasons of autumn and spring.
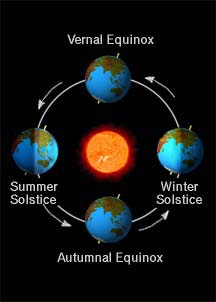
The Earth in its orbit at the solstices and equinoxes. Note that the perspective is unrealistic. It is a side-view and ignores the effect of perspective to convey that the Earth's orbit is nearly circular. Image courtesy of Windows to the Universe.
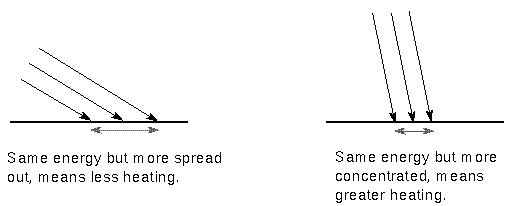
The intensity of solar radiation is largely a function of the angle at which the Sun’s rays strike the Earth’s surface, called the angle of incidence. If the Sun is positioned directly overhead, or 90 degrees from the horizon, the incoming rays strike the surface of the Earth at right angles and are most intense. If the Sun is 45 degrees above the horizon, the incoming rays strike the Earth’s surface at an angle. This causes the rays to be spread out over a larger surface area, reducing the intensity of the radiation. The following figure models the effect of changing the angle of incidence from 90 to 45 degrees. As illustrated, the lower sun angle causes the radiation to be received over a much larger surface area.

Effect of the angle on the area that receives an incoming beam of radiation. Image courtesy of The Encyclopedia of Earth.
During summer the sunlight strikes the ground more directly (closer to perpendicular), concentrating the Sun’s energy. This concentrated energy is able to heat the surface more quickly than is possible during wintertime when the Sun’s rays hit the ground at more glancing angles, spreading out the energy. From the equator to the poles, the Sun’s rays meet Earth at smaller and smaller angles, and the light gets spread over larger and larger surface areas.
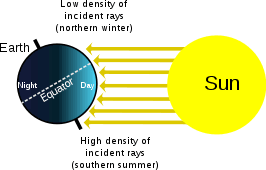
In addition to less concentrated energy, the time the Earth’s surface is bathed in light is also different. Because of the tilted axis, the parts of the Earth’s surface spent in daylight (unshaded part of the drawing) and in the shadow (shaded) are usually not equal. North of the equator, day is longer than night, and at the North Pole, there is no night at all.
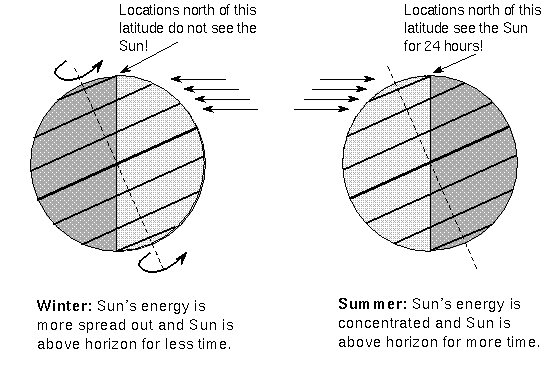
Amount of daylight in summer and winter. Illustration courtesy of Nick Strobel, www.astronomynotes.com.
At the equator the intensity of the Sun’s ray is constant and the length of the day does not change; hence, spring, summer, fall, and winter do not exist although, depending on the weather patterns, there may be a “wet” and a “dry” season.
Resources
Earth’s Seasons
A computer animation on the reason for the seasons. Voice-over describes the motion of Earth around the sun to show how the sun’s light impacts the tilted Earth at different times of the year, causing seasonal changes.
Basic Coordinates and Seasons Lab
The seasons module of the University of Nebraska-Lincoln’s Astronomy Education program enables you to understand these concepts by manipulating such things as the position of the Earth in its orbit and your position on the Earth.
Concept D. Gradual changes in Earth’s rotation and orbit around the Sun change the intensity of sunlight received in our planet’s polar and equatorial regions. For at least the last 1 million years, these changes occurred in 100,000-year cycles that produced ice ages and the shorter warm periods between them.
The work of climatologists has found evidence to suggest that only a limited number of factors are primarily responsible for most of the past episodes of climate change on Earth. One of these factors is variations in the Earth’s orbital characteristics.
The impact of variations in the Earth’s orbital characteristics was investigated by the Serbian mathematician Milutin Milankovitch beginning in the 1910s. He made a series of astronomical calculations that demonstrated how Earth’s orbital variations played a role in the ice ages and other climate variations. He found that as the Earth travels through space around the Sun, cyclical variations in three elements of Earth-Sun geometry combine to produce variations in the amount of solar energy that reaches Earth:
- Variations in the Earth’s orbital eccentricity – the shape of the orbit around the Sun.
- Changes in obliquity – changes in the angle that Earth’s axis makes with the plane of Earth’s orbit.
- Precession – the change in the direction of the Earth’s axis of rotation.
Together, the periods of these orbital motions have become known as Milankovitch cycles.
Milankovitch cycles, such as precession of the equinoxes (23,000 years), obliquity (41,000 years) and eccentricity (100,000 and 400,000 year periods), influence climate change at long time scales because they affect the amount of sunlight that radiates to Earth. They are measured using data derived from marine sediments, geomorphic features, and astronomical observations and calculations. Understanding the Milankovitch cycles helps with reconstructing past climate variability at 100,000-year and longer time scales.
At the present time, the Milankovitch cycles are at a point that places the Earth in an interglacial period – a warm period of relatively stable climate. This warm period is predicted to continue for tens of thousands of years, but is not expected to generate warmer climates over the period of decades. For this reason, recent climatic changes are not considered to be attributable to the natural cycles described by Milankovitch.
Resources
Milutin Milankovitch
A biography of Milankovitch with an emphasis on his research.
Causes of Climate Change
This article from the online Encyclopedia of Earth discusses the factors responsible for past episodes of climate change.
Climate Time Line Information Tool
This tool is designed as an interactive matrix to allow users to examine climatic information at varying scales through time.
Concept E. A significant increase or decrease in the Sun’s energy output would cause Earth to warm or cool. Satellite measurements taken over the past 30 years show that the Sun’s energy output has changed only slightly and in both directions. These changes in the Sun’s energy are thought to be too small to be the cause of the recent warming observed on Earth.
Solar scientists have long known that solar variability changes the distribution of energy in the Earth’s atmosphere, but its direct effect on climate change has been in question. Solar radiation changes have been measured reliably by satellites for only 30 years. These precise observations show changes of a few tenths of a percent that depend on the level of activity in the 11-year solar cycle. While a component of recent global climate change may have been caused by the increased solar activity of the last solar cycle, that component was very small compared to the effects of greenhouse gases.
Measurements made by satellites equipped with radiometers in the 1980s and 1990s suggested that the Sun’s energy output may be more variable than was once thought. Measurements made during the early 1980s even showed a decrease of 0.1 percent in the total amount of solar energy reaching the Earth over just an 18-month period. Scientists studying shorter term variations in the Sun’s energy output, including the 22-year solar cycle of solar activity measured between a minimum and maximum period, have determined that the amount of extra solar energy reaching Earth is relatively small, not enough to account for recent climate change.
During the initial discovery period of global climate change, the magnitude of the influence of the Sun on Earth’s climate was not well understood. Since the early 1990s, however, extensive research was put into determining what role, if any, the Sun has in global warming or climate change. A recent review paper, put together by both solar and climate scientists (Gray, et al., 2010), details these studies. Their bottom line: though the Sun may play some small role, “it is nevertheless much smaller than the estimated radiative forcing due to anthropogenic changes.” That is, human activities are the primary factor in global climate change.
Resources
Solar Activity and Climate Change
This page provides more information on the link between solar activity and climate change.
‘No Sun Link’ to Climate Change
This article, published in 2007, concludes that changes in the Sun’s output cannot be causing modern-day climate change.
References
Beyond Penguins and Polar Bears. Retrieved from http://beyondpenguins.nsdl.org
CLEAN. Teaching Climate Science and Energy Awareness. Retrieved from http://cleanet.org/clean/literacy/index.html
Encyclopedia of the Earth. Climate Literacy Handbook. Principle 1. Retrieved from http://www.eoearth.org/article/Climate_Literacy_Handbook:_Principle_1
Gray, L. J., et al. 2010. “Solar Influences on Climate.” Reviews of Geophysics 48, RG4001, doi:10.1029/2009RG000282. Retrieved from http://solar-center.stanford.edu/sun-on-earth/2009RG000282.pdf
Kimberly Lightle wrote this article. She received her PhD in science education at The Ohio State University and is principal investigator of Beyond Weather and the Water Cycle, Beyond Penguins and Polar Bears, and the Middle School Portal 2 projects. Email Kim at beyondweather@msteacher.org.
Copyright February 2011 – The Ohio State University. This material is based upon work supported by the National Science Foundation under Grant No. 1034922. Any opinions, findings, and conclusions or recommendations expressed in this material are those of the author(s) and do not necessarily reflect the views of the National Science Foundation. This work is licensed under an Attribution-ShareAlike 3.0 Unported Creative Commons license.


