
Climate Literacy: The Essential Principles of Climate Sciences summarizes the most important principles and concepts of the climate sciences. It presents information that individuals and communities need to understand Earth’s climate, the impacts of climate change, and approaches for adapting and mitigating change. This article provides background science content knowledge for understanding Essential Principle 2.
Climate is regulated by complex interactions among components of the Earth system is the second of seven Essential Principles of Climate Sciences. Another way to think about Principle 2 is that oceanic, atmospheric, biologic and geologic processes all drive the climate system. Many climatic processes are the result of interplay between the “spheres” of the Earth system (atmosphere, cryosphere, geosphere, and biosphere). The interplay between various components can work to amplify or mitigate changes to the climate. In addition, the oceans exert a major influence on the world’s climate by storing solar energy and distributing it around the planet through currents and atmospheric winds.
But first, let’s define climate. Many times the terms “climate” and “weather” are used interchangeably – but they are not the same thing.
Weather is the current atmospheric conditions, including temperature, rainfall, wind, and humidity at any given place. If you stand outside, you can tell how hot it is by taking a temperature reading or feel if it is raining or windy, sunny or cloudy. All of these factors make up what we think of as weather. Weather is what is happening right now or likely to happen tomorrow or in the very near future. Weather is the day-to-day state of the atmosphere and its short-term (minutes to weeks) variation. We all check to see what the weather will be where we live or where we will be traveling – we can easily get the current conditions and the forecast for the next few days. The following image is a national forecast map from the National Oceanic and Atmospheric Administration’s (NOAA) National Weather Service.
Weather Forecast, March 31, 2011. Courtesy of National Weather Service, NOAA.
Climate, on the other hand, is the general weather conditions. For example, in the winter, we expect it to often be rainy in Seattle, Washington, sunny and mild in southern California, and very cold and snowy in Buffalo, New York. But it would not be particularly startling to hear of an occasional January day with mild temperatures in Buffalo, rain in Los Angeles, or snow in Seattle. Meteorologists often point out that “climate is what you expect and weather is what you get.” The classical length of record to determine the climate for any particular place is 30 years, as defined by the World Meteorological Organization (WMO). The quantities most often observed are temperature, precipitation, and wind as well as cloud cover and depth of frost penetration. Below is a map showing the climate zones found in the United States based on the work of German climatologist and amateur botanist Wladimir Köppen (1846-1940). He divided the world’s climates into several major categories based upon general temperature profile related to latitude. You will find five of the six categories in the United States – A. Tropical, B. Dry, C. Moist Subtropical Mid-Latitude, D. Moist Continental Mid-latitude, and H. Highlands. The category not covered is E. Polar. You can read a full description of each category here.
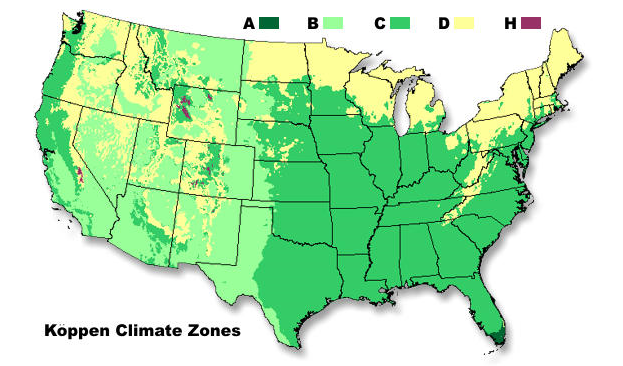
Koppen Climate Zones. Image courtesy of National Weather Service, NOAA.
The following concepts are fundamental to understanding Principle 2. Click on a concept to find the background knowledge needed to understand the concept.
Note: For additional ideas and resources for teaching each of the Essential Principles of Climate Sciences go to the Climate Literacy & Energy Awareness Network. Another good introduction to the seven essential principles is Earth: The Operator’s Manual, an hour-long film shown on PBS and based on the book of the same name by Richard Alley. The entire film is available but the site also provides short segments for teachers to preview and download (free, simple registration required), both with closed captioning for ESL and science comprehension support. A video from the U.S. Environmental Protection Agency (EPA), Climate 101 (second row, middle) explores what climate change is, signs or indicators that the planet is warming, and why it matters. Watch the video to learn more about the causes and effects of climate change and practical solutions to reduce carbon dioxide and other greenhouse gas emissions. An excellent rebuttal of climate change skeptics can be found in Why the Global Warming Skeptics Are Wrong (published 2/22/2012).
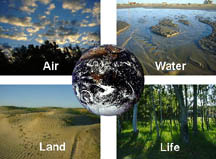
The Earth System. Photo courtesy of SERC Media.
Concept A. Earth’s climate is influenced by interactions involving the Sun, ocean, atmosphere, clouds, ice, land, and life. Climate varies by region as a result of local differences in these interactions.
Concept B. Covering 70% of Earth’s surface, the ocean exerts a major control on climate by dominating Earth’s energy and water cycles. It has the capacity to absorb large amounts of solar energy. Heat and water vapor are redistributed globally through density-driven ocean currents and atmospheric circulation. Changes in ocean circulation caused by tectonic movements or large influxes of fresh water from melting polar ice can lead to significant and even abrupt changes in climate, both locally and on global scales.
Concept C. The amount of solar energy absorbed or radiated by Earth is modulated by the atmosphere and depends on its composition. Greenhouse gases— such as water vapor, carbon dioxide, and methane— occur naturally in small amounts and absorb and release heat energy more efficiently than abundant atmospheric gases like nitrogen and oxygen. Small increases in carbon dioxide concentration have a large effect on the climate system.
Concept D. The abundance of greenhouse gases in the atmosphere is controlled by biogeochemical cycles that continually move these components between their ocean, land, life, and atmosphere reservoirs. The abundance of carbon in the atmosphere is reduced through seafloor accumulation of marine sediments and accumulation of plant biomass and is increased through deforestation and the burning of fossil fuels as well as through other processes.
Concept E. Airborne particulates, called “aerosols,” have a complex effect on Earth’s energy balance: they can cause both cooling, by reflecting incoming sunlight back out to space, and warming, by absorbing and releasing heat energy in the atmosphere. Small solid and liquid particles can be lofted into the atmosphere through a variety of natural and man-made processes, including volcanic eruptions, sea spray, forest fires, and emissions generated through human activities.
Concept F. The interconnectedness of Earth’s systems means that a significant change in any one component of the climate system can influence the equilibrium of the entire Earth system. Positive feedback loops can amplify these effects and trigger abrupt changes in the climate system. These complex interactions may result in climate change that is more rapid and on a larger scale than projected by current climate models.
You can see where these concepts are found in national standards documents as well as students’ common misconceptions in the Standards and Curriculum Connections article.
Concept A. Earth’s climate is influenced by interactions involving the Sun, ocean, atmosphere, clouds, ice, land, and life. Climate varies by region as a result of local differences in these interactions.
This concept relates to the idea that climate is best understood from an Earth system perspective. All elements of the Earth as well as important components from space affect climate. The great circulation systems of Earth – water, carbon and nutrients – replenish what life needs and help regulate the climate system. Earth is a dynamic planet; the continents, atmosphere, oceans, ice, and life are ever changing and interacting in countless ways. These complex and interconnected processes comprise the Earth system, which forms the basis of the scientific research and space observation that we refer to as Earth system science. The Earth system is often represented by interlinking and interacting “spheres” of processes and phenomena.
The atmosphere, hydrosphere, biosphere and geosphere form the simplest collection, though some would add the cryosphere as a special element dealing with polar regions and processes, and others would add the anthroposphere, emphasizing human dimensions and impact on the planet. The following image is a basic illustration of some of the most important components and interactions generating Earth’s climate.
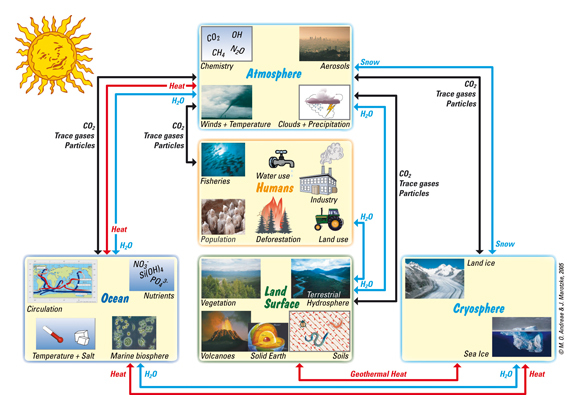
Earth System Science diagram courtesy of M.O. Andreae und J. Marotzke, 2005, Max Planck Institute.
In Earth system science, researchers take a contextual approach to scientific inquiry – they explore extreme weather events in the context of changing climate, earthquakes and volcanic eruptions in the context of tectonic shifts, and losses in biodiversity in the context of changes in Earth’s ecosystems. This leads to the exploration and discovery of causes and effects in the environment. For instance, Earth system scientists have linked ocean temperatures and circulation to the moderate climate of northern Europe relative to its latitude, the annual changes of ozone concentration over Antarctica with the production of industrial refrigerants in the Northern Hemisphere, and the physics and chemistry of the atmosphere to air quality and fresh water availability.

The Blue Marble. Photo courtesy of Visible Earth, NASA.
From space we can view the Earth as a whole system, observe the net results of complex interactions, and begin to understand how the planet is changing in response to natural and human influences. For example, Earth system science has begun to understand and quantify the effects of “forcings,” produced by the Sun’s solar variability and the atmosphere’s increasing concentrations of carbon dioxide and aerosols, on the climate system.
Resources
Piecing Together the Temperature Puzzle (5:48)
This NASA video discusses the impacts of the sun’s energy, Earth’s reflectance and greenhouse gases on the Earth System and provides an excellent overview for this entire Principle.
Earth as a System (5:30)
This short video uses animated imagery from satellite remote sensing systems to illustrate that Earth is a complex, evolving body characterized by ceaseless change. Adapted from NASA, this visualization helps explain why understanding Earth as an integrated system of components and processes is essential to science education.
EarthComm (Earth System Science in the Community)
This set of online resources was developed to support the EarthComm curriculum designed for high school students. It contains resources for teachers, students, and parents. An interactive map allows you to click on your state and select the relevant module from the list of EarthComm modules. Within each module, you can click on chapter titles to access resources and activities.
Concept B. Covering 70% of Earth’s surface, the ocean exerts a major control on climate by dominating Earth’s energy and water cycles. It has the capacity to absorb large amounts of solar energy. Heat and water vapor are redistributed globally through density-driven ocean currents and atmospheric circulation. Changes in ocean circulation caused by tectonic movements or large influxes of fresh water from melting polar ice can lead to significant and even abrupt changes in climate, both locally and on global scales.
As the ocean absorbs incoming sunlight, its surface warms. The ocean emits some of its heat up into the atmosphere, both in the form of thermal energy and water vapor, creating winds and rain clouds. In turn, surface winds push against the surface of the ocean, creating currents that help control the distribution of warm and cold waters. Where surface waters are cooler, they allow even colder, deeper depths to rise up. Where sea surface temperatures are cold, local air temperatures also tend to be cooler due to the surface winds dragging across the water. Where sea surface temperatures are warm, local air temperatures tend to be warmer due the heat emitted by the water. In short, ocean and atmosphere are intertwined.
Ocean Cycle. Illustration by David Herring, Courtesy of Earth Observatory.
The data from the NASA-funded TOPEX/Poseidon and Jason missions help us study and understand the complex interactions between the oceans and the atmosphere that affect global weather and climate events. El Niño is one well-known example of this interaction. El Niño years are characterized by an unusual extension of warm water across the Pacific Ocean, illustrated in shades of red in the image below.
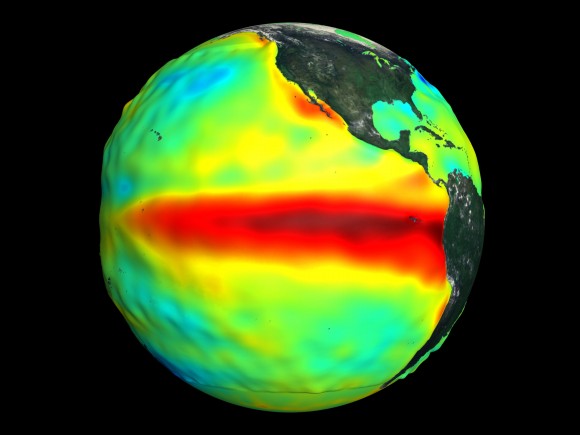
Image courtesy of NASA/Goddard Space Flight Center; The SeaWiFS Project; ORBIMAGE Science Visualization Studio.
The second way that ocean and atmosphere are linked is chemical, as the ocean is both a source and sink (natural reservoir) of greenhouse gases. Much of the heat that escapes the ocean is in the form of evaporated water, the most significant greenhouse gas by far. Yet, water vapor also contributes to the formation of clouds, which shade the surface and have a net cooling effect.
Of the greenhouse gases, carbon dioxide is perhaps the most important because of its links to human activities. Since the Industrial Revolution, atmospheric carbon dioxide has risen by 30 percent, while average global temperatures have climbed about 0.5 degrees Celsius. On average, carbon dioxide resides in the atmosphere about 100 years before it settles into the ocean, or is taken out of the atmosphere by plants. The oceanic removal of carbon dioxide from the atmosphere has a cooling affect on global temperatures. Unfortunately, the increased carbon dioxide in the ocean changes the water, making it more acidic and ocean creatures don’t like acidic water. With ocean temperatures and acidity levels increasing more every year, coral reefs are rapidly declining. The image below is a patch reef in Truk Lagoon, Micronesia. This reef is one of the most threatened, both by climate and human activities.
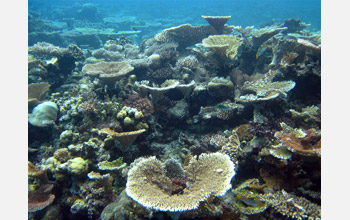
A patch reef in Truk lagoon, Micronesia. Photo courtesy of Mikhail V. Matz, University of Texas, Austin.
Resources
Changing Planet: Fading Coral (6:02)
This video provides a comprehensive introduction to the role of coral reefs, the physiology of corals, and the impacts of both ocean warming and acidification on coral survival. It highlights experts from the Bermuda Institute of Ocean Sciences and the University of Miami.
Oceans, Climate, and Weather
Designed for middle school teachers, this online resource guide offers help in teaching about the relationships between oceans, weather, and climate and in reinforcing the teacher’s content knowledge of these topics. The guide identifies lessons and activities and sources of real data for analyzing and interpreting. The guide materials align with the National Science Education Standards.
Ocean Literacy: The Essential Principles of Ocean Sciences K-12
Ocean scientists and educators developed this outline of knowledge required to be considered ocean literate and in accordance with the National Science Education Standards. Their work was supported by ocean-related groups, including the National Geographic Society’s Oceans for Life Initiative and the National Oceanic and Atmospheric Administration (NOAA).
Climate Kids: What is Happening to the Oceans?
Produced by NASA’s Jet Propulsion Laboratory, this web site lists and answers “Big Questions” as well as “smaller questions” about the oceans, including how the oceans affect climate. Short video clip about the climate, games, and a list of educator resources.
Concept C. The amount of solar energy absorbed or radiated by Earth is modulated by the atmosphere and depends on its composition. Greenhouse gases – such as water vapor, carbon dioxide, and methane – occur naturally in small amounts and absorb and release heat energy more efficiently than abundant atmospheric gases like nitrogen and oxygen. Small increases in carbon dioxide concentration have a large effect on the climate system.
Almost all of us have experienced getting into our cars on a warm summer day and realizing that the car’s interior is much warmer than the outside. This is the greenhouse effect in action. Visible light from the Sun goes through your car windows and is absorbed in the interior causing an increase in temperature. The seats then radiate energy, but in the form of infrared rather than visible light. Even though we can’t see infrared light without specialized equipment, it can be felt in the form of heat.
The following photographs help us understand the differences between visible and infrared light. In the first photo, taken in visible light, the plastic bag is opaque, and the man’s hands cannot be seen. His glasses, on the other hand, are transparent and you can see his eyes. In the second photograph, infrared light passes straight through this black plastic bag and we can see the man’s hands, but his glasses, which are transparent to visible light, are completely opaque here in the infrared.

Hands in a Bag (color): Visible Light. Photo courtesy of Jet Propulsion Laboratory.

Hands in a Bag (color): Infrared Light. Photo courtesy of Jet Propulsion Laboratory.
Visible light escapes through the windows while the infrared light remains trapped, resulting in an increase in temperature. Earth’s atmosphere behaves much like our car windows. Some of the gases in our atmosphere, such as carbon dioxide, methane, and even water vapor have the ability to trap or block the transmission of infrared light. Without the greenhouse effect, infrared light leaving the Earth’s surface would escape into space, leaving the Earth much cooler than it is, particularly at night. The gases in our atmosphere prevent that from happening and trap the heat.
An example of what happens when such concentrations are too high can be seen by looking at our planetary neighbor, Venus. Venus’ atmosphere is more than 96 percent carbon dioxide (compared to 0.038 percent on Earth), and the temperature can reach 460 degrees Celsius (890 degrees Fahrenheit). On the other hand, the planet Mars has a very thin atmosphere and is quite cold at minus 63 degrees Celsius (minus 81 degrees Fahrenheit).
Resources
What Is Infrared?
This image-filled site will give you insight into infrared light. It is produced as an education and public outreach effort of NASA’s Space Infrared Telescope Facility.
Climate Kids: What is the Greenhouse Effect?
In question-and-answer format with many illustrations, this site answers questions a student might have about the greenhouse effect. The site also includes questions scientists are trying to find answers to, all written in an easy-to-read style.
Greenhouse Effect Movie
In this movie, Professor Scott Denning of the Atmospheric Science Department at Colorado State University explains how greenhouse gases in Earth’s atmosphere warm our planet. In this lively, animated presentation, Professor Denning first explains how visible light (a form of electromagnetic radiation) from the Sun delivers energy to Earth. Next, he describes how some of this energy is trapped in Earth’s atmosphere by the greenhouse effect, which warms our planet. Molecules of greenhouse gases, especially water vapor and carbon dioxide, “recycle” some of the heat energy which would otherwise escape from Earth in the form of infrared radiation.
Concept D. The abundance of greenhouse gases in the atmosphere is controlled by biogeochemical cycles that continually move these components between their ocean, land, life, and atmosphere reservoirs. The abundance of carbon in the atmosphere is reduced through seafloor accumulation of marine sediments and accumulation of plant biomass and is increased through deforestation and the burning of fossil fuels as well as through other processes.
All biogeochemical cycles, including the hydrologic, nitrogen, oxygen, and phosphorus cycles, directly or indirectly impact Earth’s climate. The hydrologic cycle is probably the one most people are familiar with but most diagrams don’t include an important part of the water cycle – ice! Earth’s ice, existing in various forms such as sea ice, ice shelves, icebergs, ice sheets, glaciers, lake ice, river ice, snow, and permafrost, even has a special name: the cryosphere. We learn that precipitation means rain, hail, snow, or sleet, but many diagrams of the cycle include rain as the sole form of precipitation.
Additionally, because of the use of the word cycle, we may mistakenly believe that the water is continuously moving through its various forms. Actually, much more water is in storage than is moving through the cycle. In fact, ice caps and glaciers store the second highest percentage of water (the world’s oceans being the first). And while water is stored as ice, summer melt of ice sheets and glaciers and calving of icebergs are also contributions to the cycling of water. The following diagram includes snow and ice and is available from the U.S. Geological Survey in a variety of forms and languages.
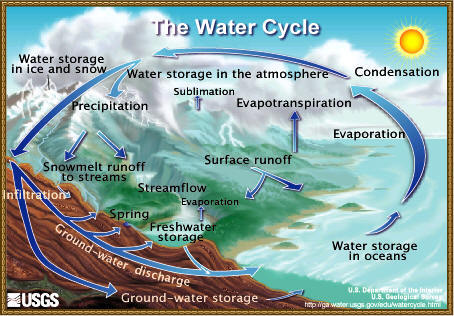
The Water Cycle. Image courtesy of the U.S. Geological Survey.
Carbon cycling involves many carbon-containing compounds and biological processes such as photosynthesis. On a longer time span, carbon dioxide is moved from the atmosphere and the ocean and into the ground through biologic and geologic processes. Some carbon is transformed into calcium carbonate (limestone), the largest carbon reservoir on Earth as shown in the following image. Carbon is reduced by the accumulation of seafloor sediments and the uptake of carbon by plants as they make carbohydrates.
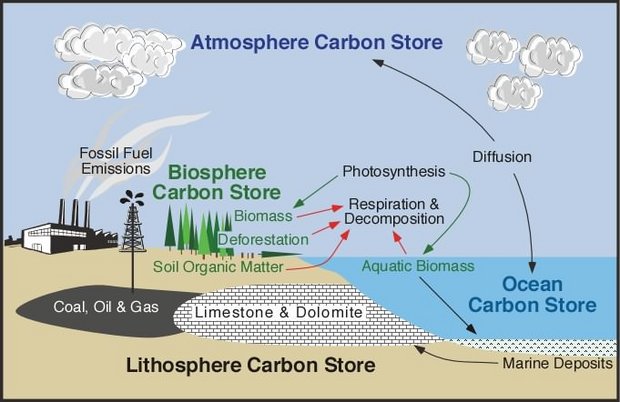
The Carbon Cycle. Image courtesy of PhysicalGeography.net.
Two processes that increase the abundance of carbon in the atmosphere are deforestation and the combustion of fossil fuels – basically the reverse of the two processes that decrease the amount of carbon in the atmosphere. Trees are natural consumers of carbon dioxide – one of the greenhouse gases whose buildup in the atmosphere contributes to global warming. Destruction of trees not only removes these “carbon sinks,” but tree burning and decomposition pump into the atmosphere even more carbon dioxide, along with methane, another major greenhouse gas. Burning any fossil fuel produces carbon dioxide, which contributes to the “greenhouse effect”, warming the Earth.
Resources
The Water Cycle
This comprehensive resource from the U.S. Geological Survey provides all the background information needed to teach the water cycle. The interactive site’s pages include a diagram (pictured above) available with or without labels and in several languages, a link to a student-friendly image of the water cycle, and links to a wealth of information about each step of the water cycle. A narrative story follows a drop of water through the cycle, but doesn’t include snow or ice in its many possibilities. Summaries of the water cycle (written for teachers) are available in several forms: full summary, text-only, and a one-page quick version.
Global Warming: It’s All About Carbon
A five-part series of humorous animated shorts that illustrate the central role that carbon plays in climate change. From NPR’s Climate Connections series.
Photosynthesis
This video segment from Interactive NOVA: Earth explores the history of plant biology. It takes the viewer from the earliest scientific hypotheses that plants ate dirt, to our present-day understanding of photosynthesis, the process by which plants use the sun’s energy to convert carbon dioxide and water into carbohydrates, a storable form of chemical energy.
Carbon Dioxide and the Greenhouse Effect
Human activities are causing increasing amounts of carbon dioxide to be pumped into the atmosphere. But is this increase resulting in global warming? This video segment adapted from NOVA/FRONTLINE demonstrates carbon dioxide’s role in the greenhouse effect and explains how increasing concentrations of this gas in the atmosphere may be contributing to global warming.
Concept E. Airborne particulates, called “aerosols,” have a complex effect on Earth’s energy balance: they can cause both cooling, by reflecting incoming sunlight back out to space, and warming, by absorbing and releasing heat energy in the atmosphere. Small solid and liquid particles can be lofted into the atmosphere through a variety of natural and manmade processes, including volcanic eruptions, sea spray, forest fires, and emissions generated through human activities.
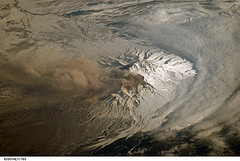
A plume at Shiveluch Volcano, Kamchatka Peninsula, Russia. Photograph courtesy of Marshall Space Flight Center, NASA.
Most people think of hairspray when the word “aerosol” is used but when scientists use the word they are thinking about small particles that can absorb and reflect incoming sunlight. Aerosols, small particles suspended in air with a lifetime of at least minutes, are either emitted as primary aerosols (dust or particle emissions of diesel cars) or formed by the conversion of sulfur dioxide, nitrogen oxides, ammonia and organic compounds in atmospheric chemical reactions. Key aerosol groups include sulfates, organic carbon, black carbon, nitrates, mineral dust, and sea salt. In practice, many of these terms are imperfect, as aerosols often clump together to form complex mixtures. It’s common, for example, for particles of black carbon from soot or smoke to mix with nitrates and sulfates, or to coat the surfaces of dust, creating hybrid particles.
While the role of aerosols in the climate system has been known since the late 1800s, their complex interactions on climate are still being studied. Some may have a cooling effect in the short term but a warming effect in the long term. Different aerosols scatter or absorb sunlight to varying degrees, depending on their physical properties. Climatologists describe these scattering and absorbing properties as the “direct effect” of aerosols on Earth’s radiation field. However, since aerosols comprise such a broad collection of particles with different properties, the overall effect is anything but simple. Although most aerosols reflect sunlight, some also absorb it. An aerosol’s effect on light depends primarily on the composition and color of the particles. Broadly speaking, bright-colored or translucent particles tend to reflect radiation in all directions and back towards space. Darker aerosols can absorb significant amounts of light.
In addition to scattering or absorbing radiation, aerosols can alter the reflectivity, or albedo, of the planet. Bright surfaces reflect radiation and cool the climate, whereas darker surfaces absorb radiation and produce a warming effect. White sheets of sea ice, for example, reflect a great deal of radiation, whereas darker surfaces, such as the ocean, tend to absorb solar radiation and have a net warming effect.
Scientists believe the cooling from sulfates and other reflective aerosols overwhelms the warming effect of black carbon and other absorbing aerosols over the planet. Models estimate that aerosols have had a cooling effect that has counteracted about half of the warming caused by the build-up of greenhouse gases since the 1880s. However, unlike many greenhouse gases, aerosols are not distributed evenly around the planet, so their impacts are most strongly felt on a regional scale as shown on the following illustration. This map shows the global distribution of aerosols and the proportion of those aerosols that are large or small. Intense colors indicate a thick layer of aerosols. Yellow areas are predominantly coarse particles, like dust, and red areas are mainly fine aerosols, like smoke or pollution. Gray indicates areas with no data.
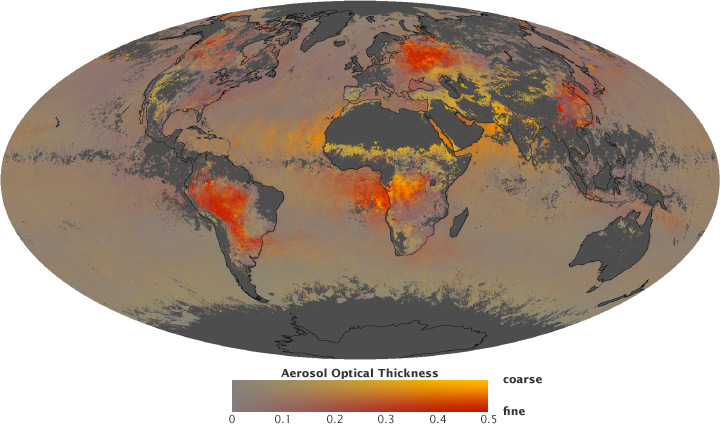
NASA map by Robert Simmon, based on MODIS data from NASA Earth Observations.
Resources
Aerosols: Tiny Particles, Big Impact
This feature article from NASA’s Earth Observatory provides information how aerosols are produced and their impact on climate. Great images.
Concept F. The interconnectedness of Earth’s systems means that a significant change in any one component of the climate system can influence the equilibrium of the entire Earth system. Positive feedback loops can amplify these effects and trigger abrupt changes in the climate system. These complex interactions may result in climate change that is more rapid and on a larger scale than projected by current climate models.
Abrupt climate change triggered by feedback loops in the climate system have occurred many times in Earth’s history. The decreasing extent of ice in the polar regions (in particular, the sea ice of the Arctic) is part of a positive feedback loop that can accelerate climate change. Warmer temperatures melt snow and ice, which decreases Earth’s albedo, causing further warming and more melting.
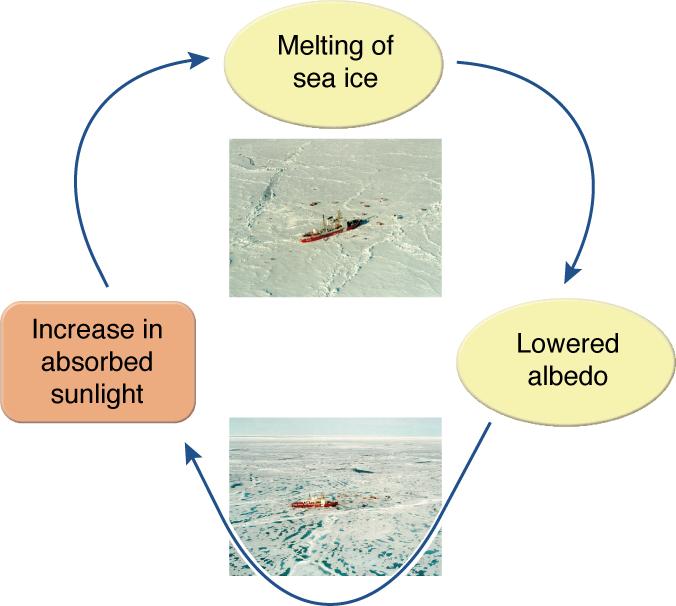
Image courtesy of Hugo Ahlenius, UNEP/GRID-Arendal Maps and Graphics Library.
Another example involves temperature, cloud cover, and solar radiation. It is thought that if climate warms, evaporation will also increase, in turn increasing cloud cover. Because clouds have high albedo (reflect more solar radiation), more cloud cover will increase the earth’s albedo and reduce the amount of solar radiation absorbed at the surface. Clouds should therefore inhibit further rises in temperature. This temperature-cloud cover-radiation feedback is negative as the initial temperature change is reduced.

Cumulonimbus Cloud Over Africa. Photograph courtesy of Marshall Space Flight Center, NASA.
However, cloud cover also acts as a blanket to inhibit loss of long-wave radiation from the earth’s atmosphere. By this process, an increase in temperature leading to an increase in cloud cover could lead to a further increase in temperature – a positive feedback. Which of these two processes dominates is still an ongoing research study.
References
Beyond Penguins and Polar Bears. Retrieved from http://beyondpenguins.nsdl.org
CLEAN. Teaching Climate Science and Energy Awareness. Retrieved from http://cleanet.org/clean/literacy/index.html
Encyclopedia of the Earth. Climate Literacy Handbook. Principle 2. Retrieved from http://www.eoearth.org/article/Climate_Literacy_Handbook:_Principle_2
University of Michigan. Deforestation. Retrieved from http://www.globalchange.umich.edu/globalchange2/current/lectures/deforest/deforest.html
Kimberly Lightle wrote this article. She received her PhD in science education at The Ohio State University and is principal investigator of Beyond Weather and the Water Cycle, Beyond Penguins and Polar Bears, and the Middle School Portal 2 projects. Email Kim at beyondweather@msteacher.org.
Copyright March 2011 – The Ohio State University. This material is based upon work supported by the National Science Foundation under Grant No. 1034922. Any opinions, findings, and conclusions or recommendations expressed in this material are those of the author(s) and do not necessarily reflect the views of the National Science Foundation. This work is licensed under an Attribution-ShareAlike 3.0 Unported Creative Commons license.